Custom Charts Gadget
Display Options
Control how your Custom Chart looks: formatting, tooltips, labels, layout, and export behavior.
Where to find it
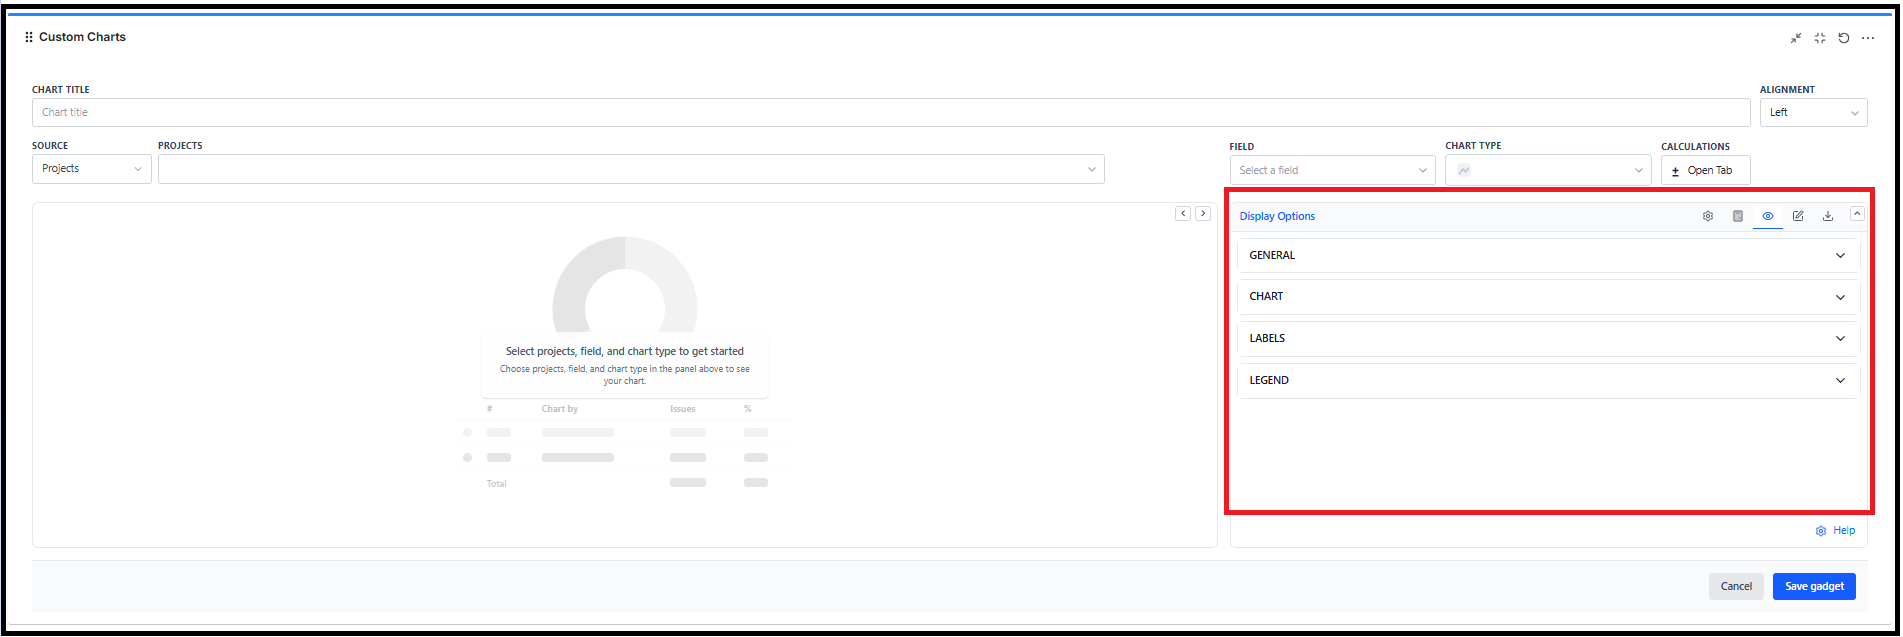
- Open a Custom Chart gadget
- Click Edit
- Go to the Display Options tab
What you can change
- Formatting (date format, % decimal places)
- Chart behavior (tooltips, hover display, gridlines, totals)
- Labels (heading and column/metric labels)
- Layout controls (pie size, axis height, table/tile limits)
- Export + menu (options menu button, direct export enable/disable)
General settings (available across chart types)
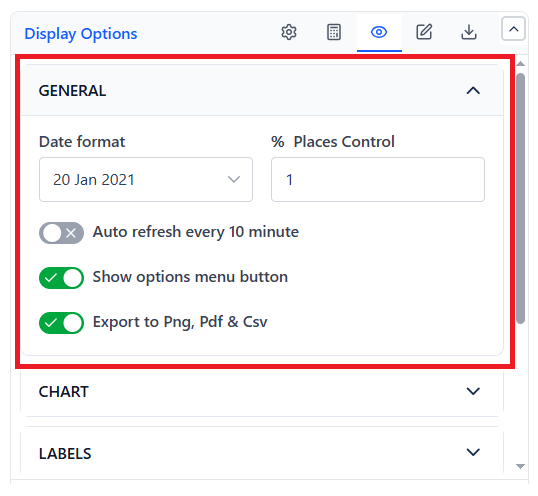
| Setting | What it does | Default |
|---|---|---|
| Date format | Controls how dates appear in charts/tooltips where dates are shown. | 20 Jan 2021 (DD Mon YYYY) |
| % Places Control | Sets decimal places for percentage values shown in labels/tooltips. | 1 |
| Auto refresh every 10 minute | Refreshes the gadget automatically (primarily useful in View mode). | Off |
| Show options menu button | Shows the chart's options/menu button (for quick actions). | On |
| Export to Png, Pdf & Csv | Enables direct export from the gadget. | On (may be disabled by admin) |
If export is disabled by admin, the toggle will show "Disabled by admin" and exports won't be available.
Pie / Funnel charts (Display Options)
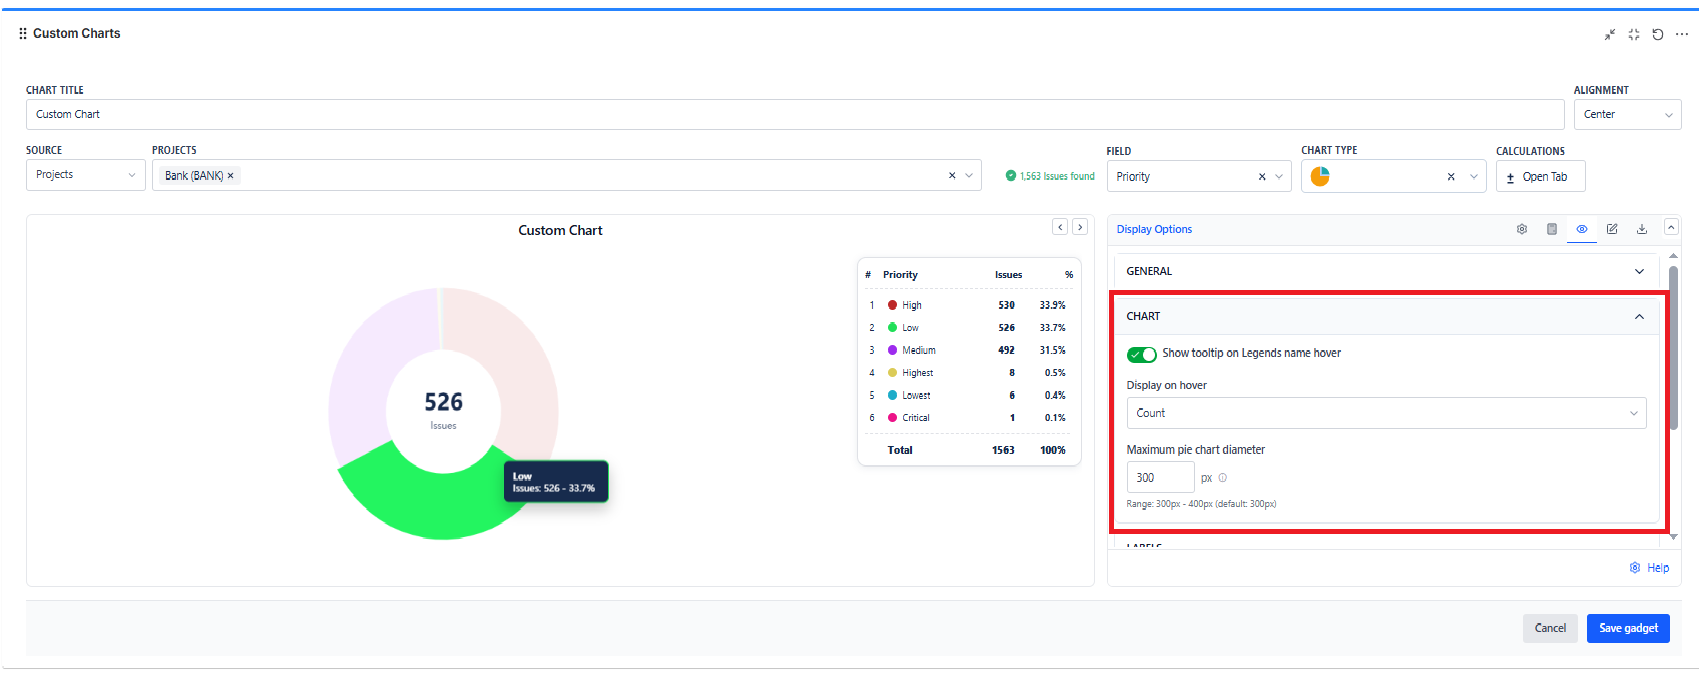
Chart options
| Setting | What it does | Default |
|---|---|---|
| Show tooltip on Legends name hover | Hover over legend items to see tooltip details. | On |
| Display on hover | What appears on hover: Count, Count / %, %, % / Count. | Count |
| Maximum pie chart diameter | Controls pie size (range: 300-400px). (Pie only) | 300px |
| Y-axis height | Vertical size control (Funnel only) (range: 320-800px). | 350px |
Labels
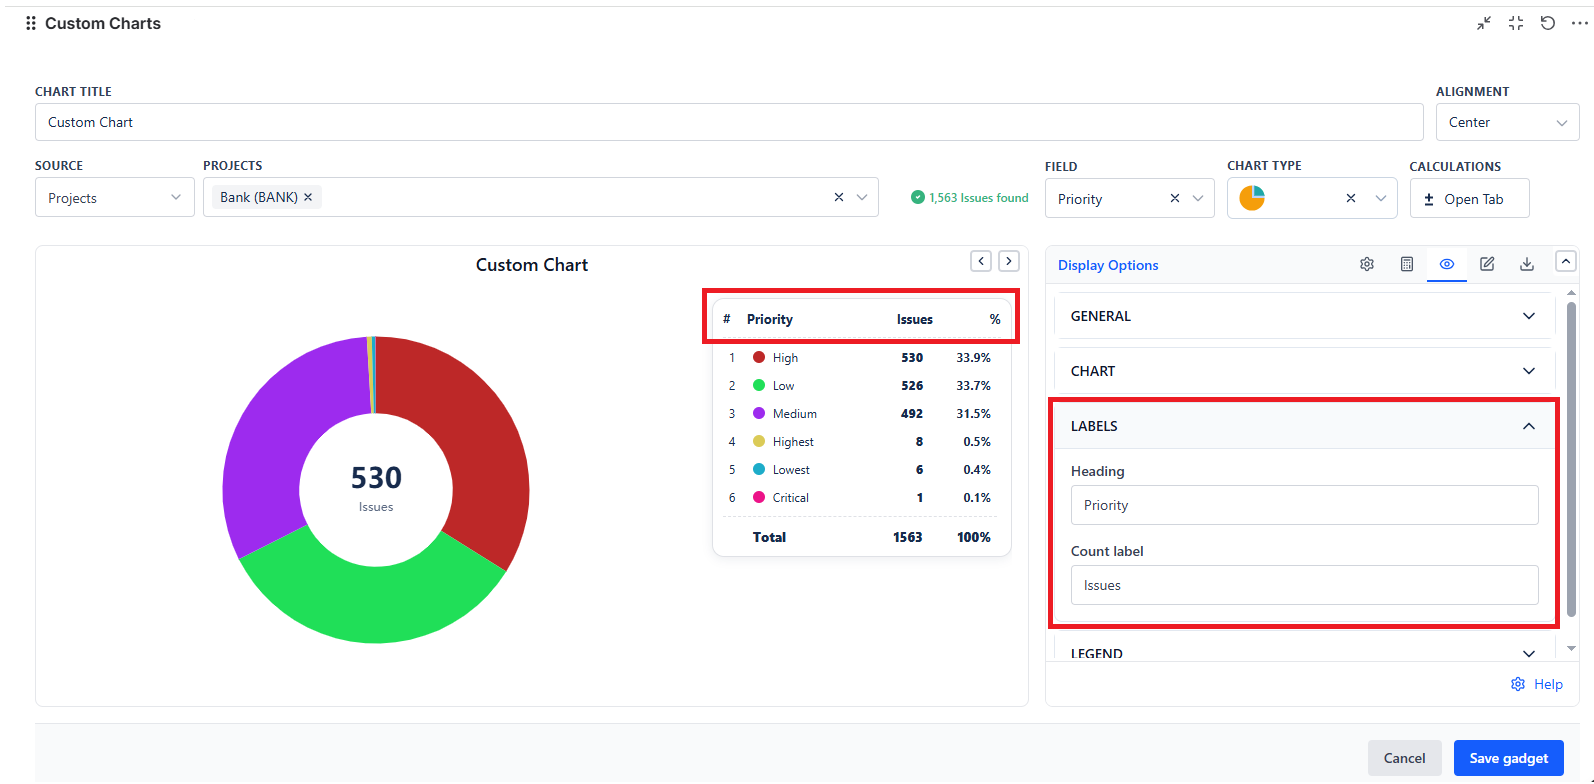
| Setting | What it does | Default |
|---|---|---|
| Heading | Heading label shown with the chart/legend area. | Blank |
| Count label | Label for count values (ex: "Issues", "Tickets"). | Issues |
Legend display
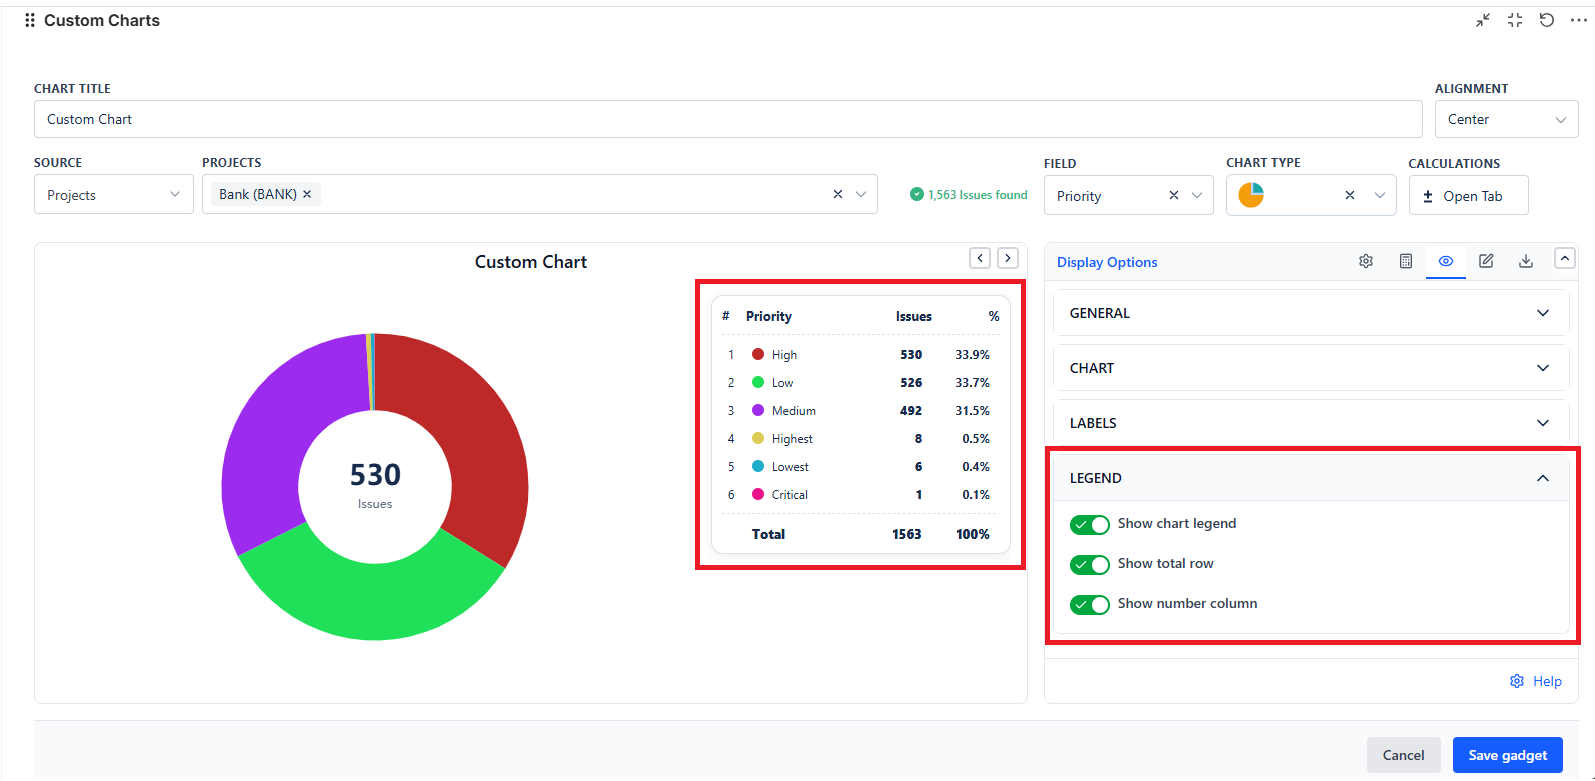
| Setting | What it does | Default |
|---|---|---|
| Show chart legend | Shows/hides the legend list. | On |
| Show total row | Shows a total row in the legend/table area (where applicable). | On |
| Show number column | Shows the serial/number column in the legend/table area. | On |
Example (Pie): If you want quick context without clicking, set Display on hover = Count / % and % Places Control = 1.
Bar charts (Bar / Grouped Bar / Stacked Bar)
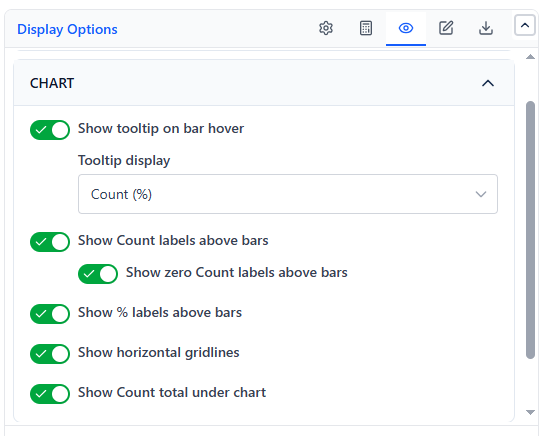
Chart options
| Setting | What it does | Default |
|---|---|---|
| Show tooltip on bar hover | Shows tooltip when hovering a bar. | On |
| Tooltip display | Tooltip format: Count, %, Count (%), % (Count). | Count (%) |
| Show Count labels above bars | Prints count values above each bar. | On |
| Show zero Count labels above bars | Also shows labels for bars with 0 count. | Off |
| Show % labels above bars | Prints % labels above bars. | Off |
| Show horizontal gridlines | Adds horizontal gridlines for readability. | Off |
| Show Count total under chart | Displays total count below the chart. | On |
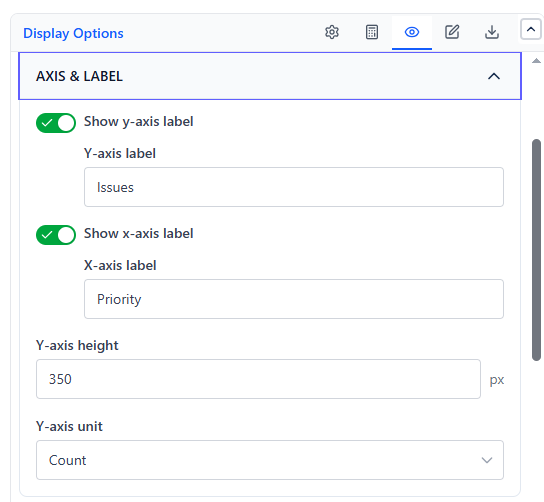
Axis & label
| Setting | What it does | Default |
|---|---|---|
| Show y-axis label | Toggles Y-axis label. | On |
| Y-axis label | Custom Y-axis title text. | Issues |
| Show x-axis label | Toggles X-axis label. | On |
| X-axis label | Custom X-axis title text. | Date |
| Y-axis height | Chart height control (range: 320-800px). | 350px |
| Y-axis unit | Shows axis values as Count or %. | Count |
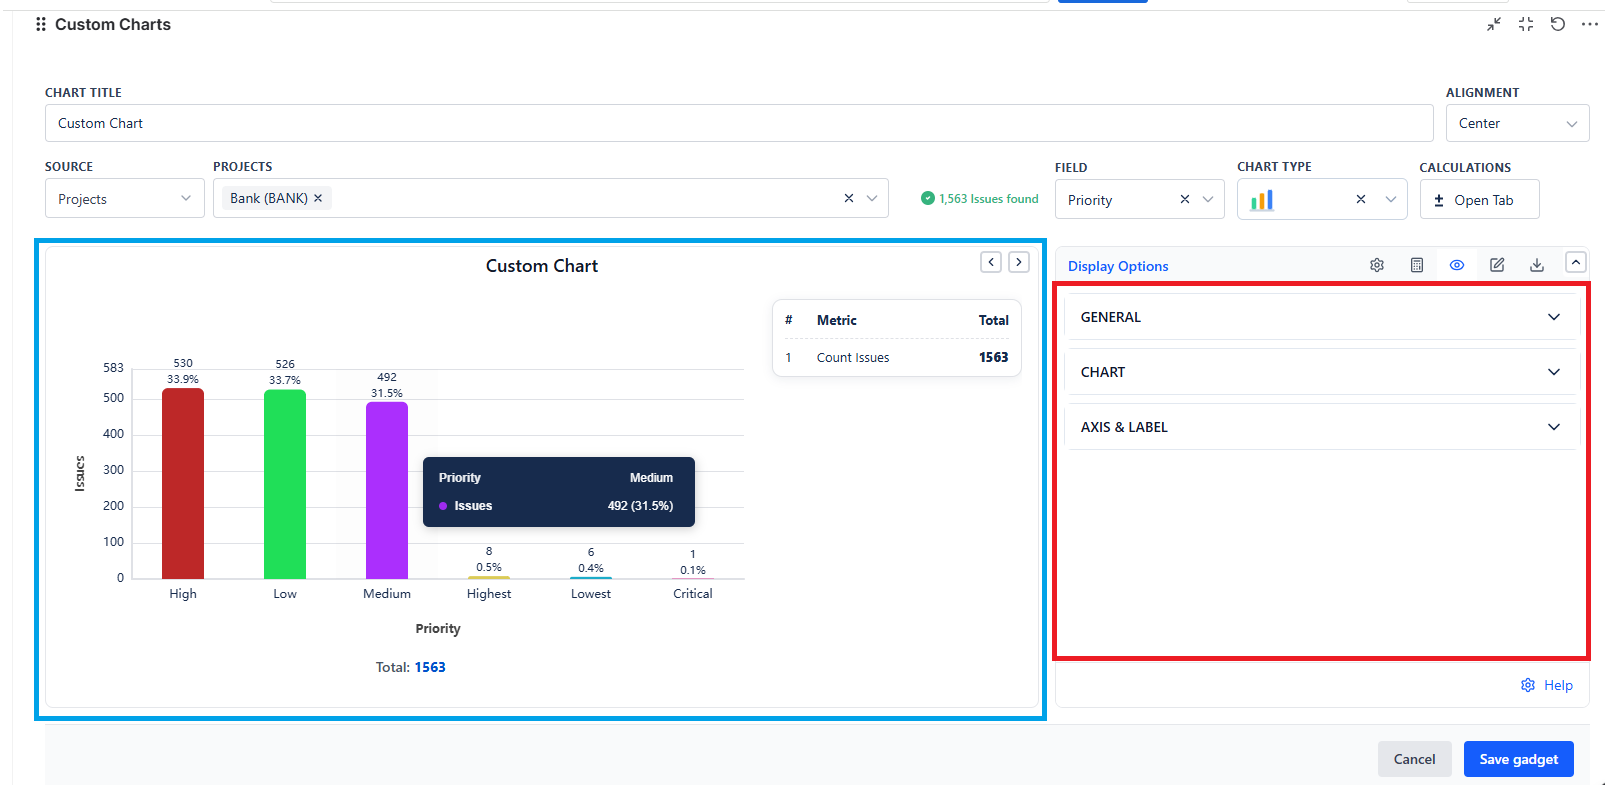
Example (Bar): To display distribution instead of raw totals: set Y-axis unit = %, enable Show % labels above bars, and keep % Places Control = 1.
Line charts (Line / Line 2D)
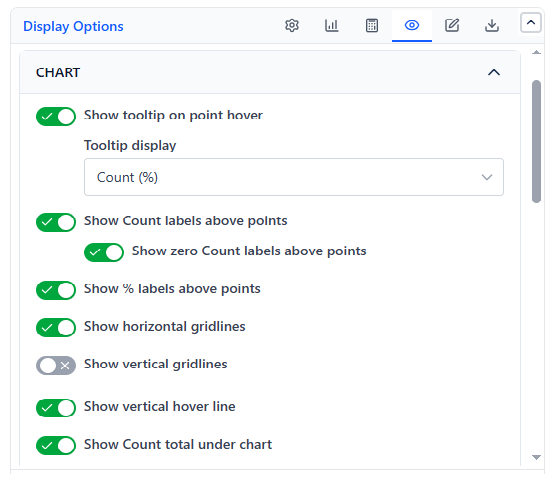
Chart options
| Setting | What it does | Default |
|---|---|---|
| Show tooltip on point hover | Shows tooltip when hovering a point. | On |
| Tooltip display | Tooltip format: Count, %, Count (%), % (Count). | Count (%) |
| Show Count labels above points | Prints count values above points. | On |
| Show zero Count labels above points | Shows labels for 0 values. | Off |
| Show % labels above points | Prints % labels above points. | Off |
| Show horizontal gridlines | Adds horizontal gridlines. | Off |
| Show vertical gridlines | Adds vertical gridlines. | Off |
| Show vertical hover line | Shows a vertical guide line on hover. | On |
| Show Count total under chart | Displays total count below the chart. | On |
Axis & label
| Setting | What it does | Default |
|---|---|---|
| Show y-axis label / Y-axis label | Toggle + text for Y-axis title. | On / Issues |
| Show x-axis label / X-axis label | Toggle + text for X-axis title. | On / Date |
| Y-axis height | Chart height control (range: 320-800px). | 350px |
| Y-axis unit | Axis unit: Count or %. | Count |
Table charts (Table / Table 2D)
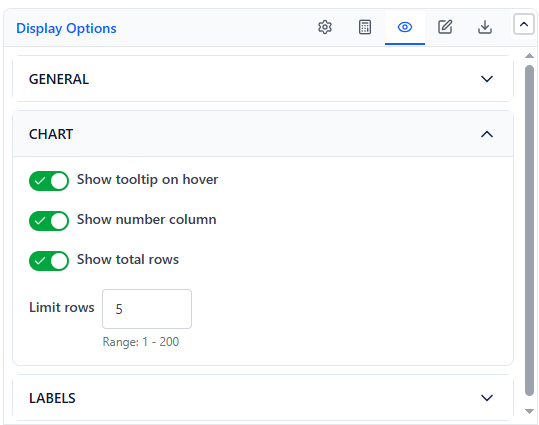
Chart options
| Setting | What it does | Default |
|---|---|---|
| Show tooltip on hover | Shows tooltip when hovering over values/names. | On |
| Show number column | Adds a serial/number column. | On |
| Show total rows | Adds total row(s) at bottom. | On |
| Limit rows | Limits table rows shown (range: 1-200). | 5 |
Table 2D only
| Setting | What it does | Default |
|---|---|---|
| Show total column | Adds a total column to the right. | On |
| Display | Chooses how values display: Count, Count / %, %, % / Count. | Count |
| Group By Label | Custom label for the group-by dimension. | Blank |
| Show group by heading label | Shows/hides the group-by heading label. | On |
Labels
| Setting | What it does | Default |
|---|---|---|
| Heading | Table heading label. | Blank |
| Count label | Column label for count values. | Issues |
Example (Table): For clean dashboards, set Limit rows = 10-20, enable Show total rows, and keep Display = Count / % for executive summaries (Table 2D).
Tile chart
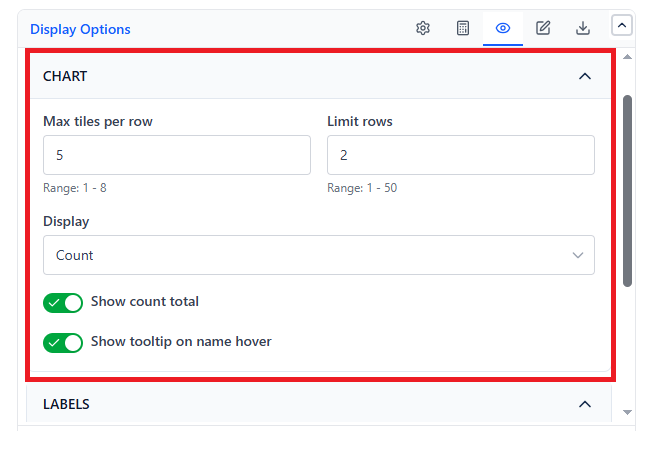
Chart options
| Setting | What it does | Default |
|---|---|---|
| Max tiles per row | Controls how many tiles appear in one row (range: 1-8). | 5 |
| Limit rows | Controls how many tile rows appear (range: 1-50). | 2 |
| Display | Tile content format: Count, Count / %, %, % / Count, Name only. | Count |
| Show count total | Shows the total count summary (where applicable). | On |
| Show tooltip on name hover | Shows tooltip when hovering tile name. | On |
Labels
| Setting | What it does | Default |
|---|---|---|
| Heading | Tile section heading label. | Blank |
| Count label | Label for count values. | Issues |
| Show chart by and count labels | Shows/hides footer labels for chart-by + count label. | On |
Example (Tiles): For compact widgets, use Max tiles per row = 4, Limit rows = 2, and Display = Count / %.
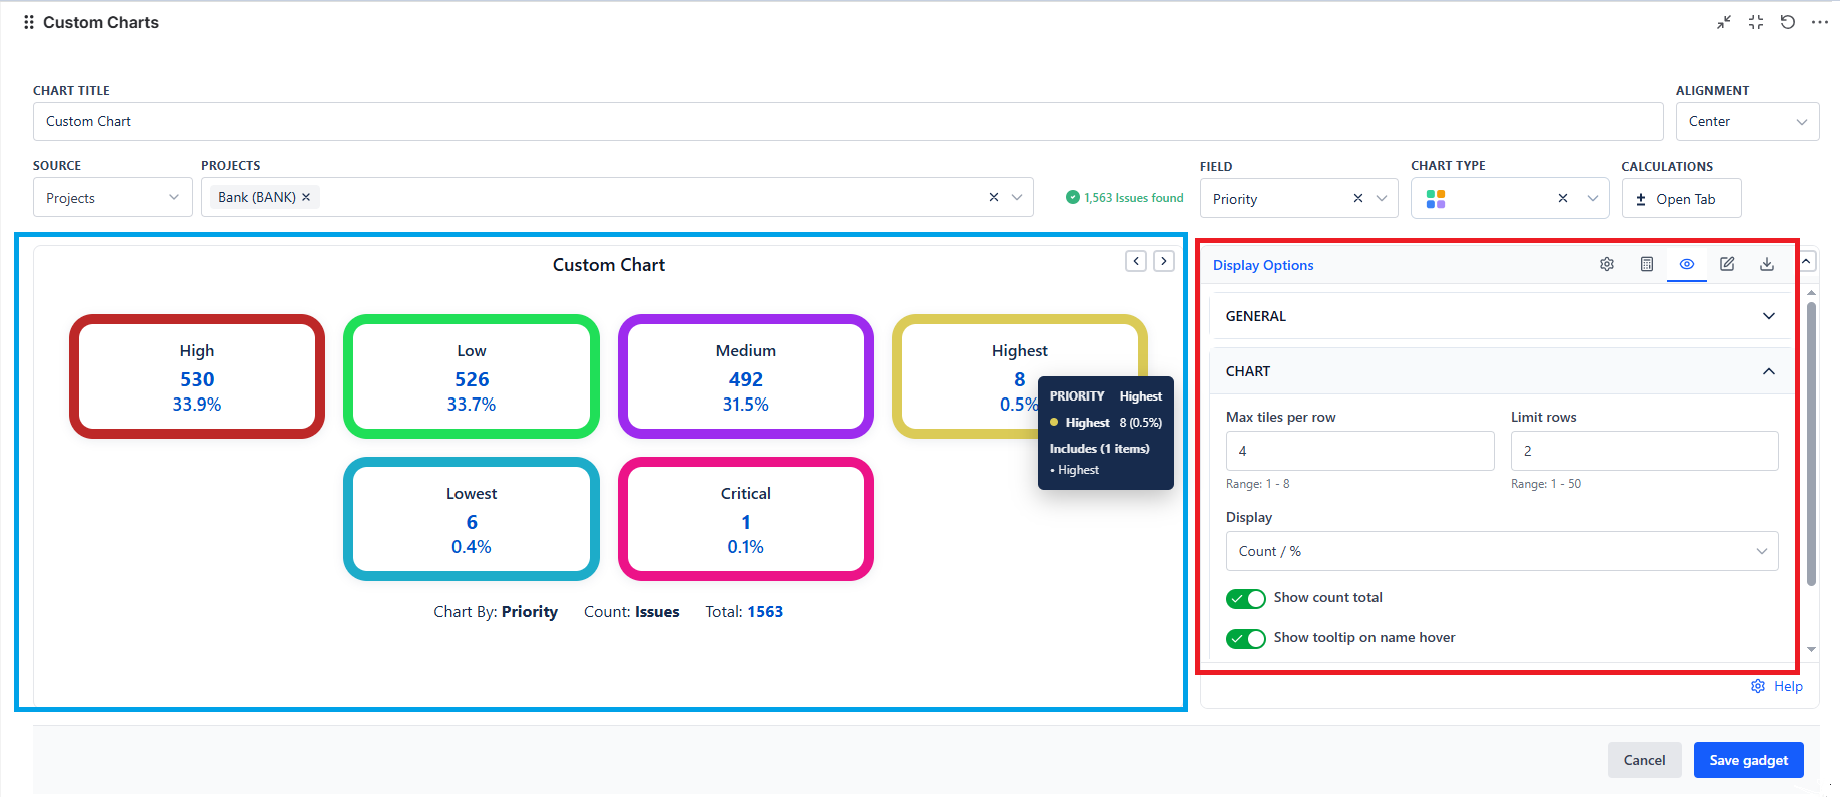
Quick tips
- Keep % Places Control = 0-1 for clean dashboards.
- Use Limit rows (Table) / Limit rows + Max tiles per row (Tile) to avoid overcrowding.
- Turn Auto refresh ON for live dashboards; keep it OFF for static reports.
- If users can't export, check whether Export is disabled by admin.