Issue List Gadget
Display Options & Export
Control how the table looks, how many issues appear per page, and how to export the data.
Display Options
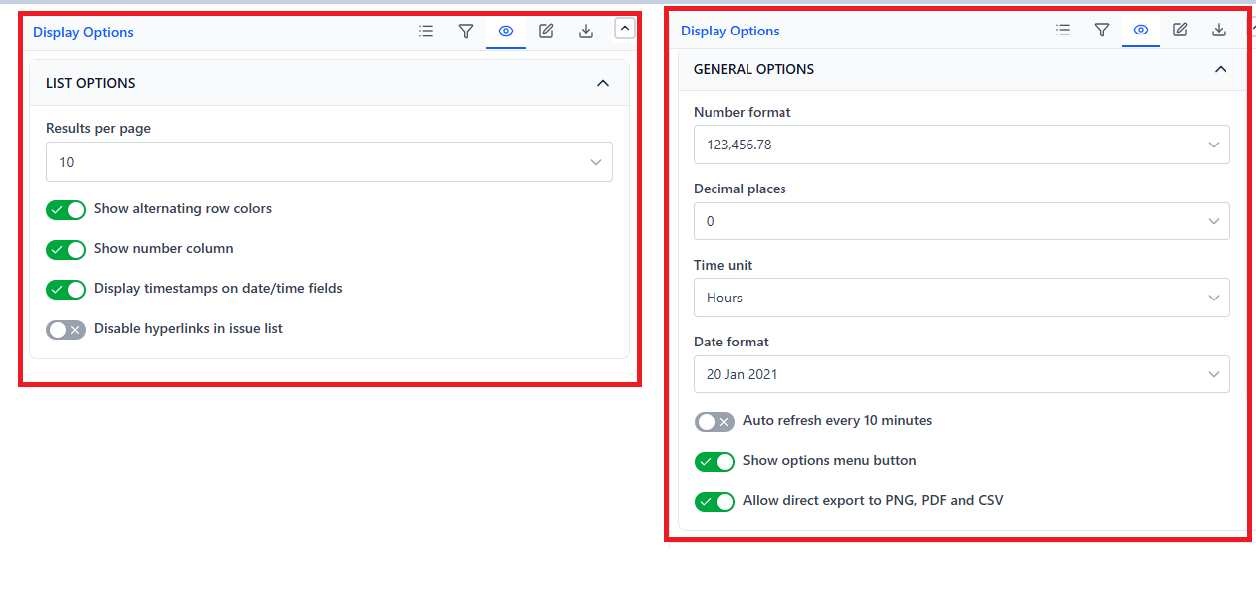
| Option | What It Does | Default |
|---|---|---|
| Results per page | Number of issues shown per page: 5, 10, 20, or 50 | 10 |
| Alternating row colors | Striped rows for easier reading | Off |
| Show number column | Adds a row number in the first column | Off |
| Show timestamps | Shows time alongside date values (e.g., "Jan 06, 2025 14:32") | Off |
| Show user icons | Shows avatar images for Assignee and Reporter | On |
| Disable hyperlinks | Turns off clickable issue key links | Off |
Tip: Enable alternating row colors on wide tables - it makes it much easier to track a row across many columns without losing your place.
Sorting
Click any column header to sort the table by that column. Click again to reverse the sort direction. Sorting applies to the current filtered result set.
Export
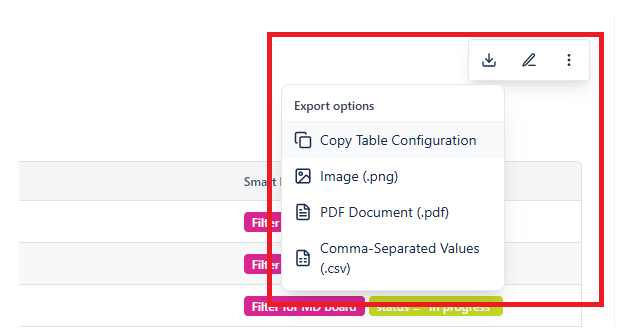
| Format | Best For |
|---|---|
| CSV | Opening in Excel or Google Sheets for further analysis |
| PNG | Including the table as an image in presentations or emails |
| Printable document for stakeholder reports | |
| Configuration | JSON backup of all gadget settings for reuse or backup |
Tip: The export includes only the currently filtered data. If you have Quick Filters active, the export reflects those filters - useful for exporting exactly "all critical open bugs" without editing the underlying data source.