Custom Charts Report
Chart Templates
Reports, Charts, Templates, CQL & Export for Confluence includes 17 pre-built chart templates. Each one is ready to use - just select, review in Live Preview, and save.
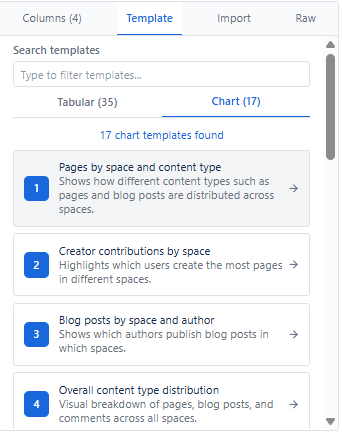
| # | Template Name | Chart Type | Groups By | Use Case |
|---|---|---|---|---|
| 1 | Pages by space and content type | Bar (Stacked) | Space + Type | Compare pages vs blogs per space |
| 2 | Creator contributions by space | Bar (Stacked) | Creator + Space | Identify top content creators per space |
| 3 | Blog posts by space and author | Bar (Stacked) | Space + Author | See who publishes blogs and where |
| 4 | Overall content type distribution | Pie | Type | Understand content mix across instance |
| 5 | Daily page activity by space | Line | Day + Space | Track daily update trends per space |
| 6 | Total pages per space | Bar | Space | Compare space sizes by page volume |
| 7 | Most active spaces (last 30 days) | Bar | Space | Rank spaces by recent activity |
| 8 | Comments by space | Bar | Space | Measure discussion intensity per space |
| 9 | Comments by author | Bar | Author | Identify top commenters |
| 10 | Pages created over time | Line | Month (createdDate) | Track content growth trend |
| 11 | Pages updated over time | Line | Month (lastUpdated) | Track update cadence (maintenance) |
| 12 | Attachments by space | Bar | Space | Compare file usage across spaces |
| 13 | Attachments by file type | Pie | mediaType | Understand file format distribution |
| 14 | Blog posts over time | Line | Month (createdDate) | Track publishing frequency trend |
| 15 | Top page editors | Bar | Last Editor | Identify most active editors |
| 16 | Overall content growth summary | Line | Month + Type | Compare pages vs blogs growth trend |
| 17 | Comments over time | Line | Month (createdDate) | Track discussion volume trend |
Quick-Start Guide
- Open macro editor → navigate to Templates tab.
- Search 'chart' or scroll to chart templates.
- Click a template - it auto-configures source, expansions, chart type, and group settings.
- Review in Live Preview.
- Adjust filters or result limit if needed.
- Save to your Confluence page.