Custom Tabular Report
Table View
Table view displays Confluence data in rows and columns - a familiar spreadsheet-style layout. It is the primary and most versatile report type in Reports, Charts, Templates, CQL & Export for Confluence.
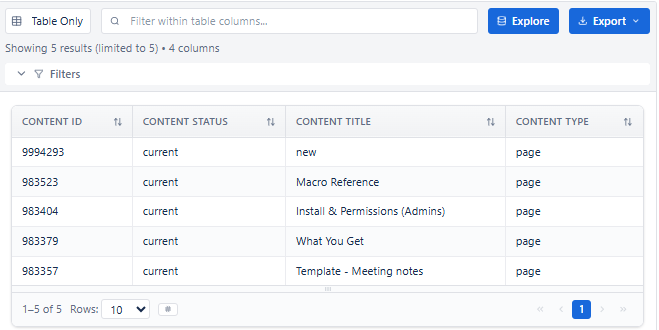
Key Features
| Feature | Description |
|---|---|
| Column headers | Defined by your Columns tab - label, block type, and source field |
| Sortable columns | Click any header to sort ascending or descending |
| Inline search | Filter visible rows by keyword - no data reload |
| CSV export | Download all visible columns and filtered data as a spreadsheet |
| JSON export | Full data structure download for developers or integrations |
| Pagination | Navigate large datasets with Previous/Next and page numbers |
| Result Limit | Control how many rows appear per page |
| All 6 block types | Basic, Image, Link, Collection, Regex, Text - all supported |
Column Block Types in Table View
| Block Type | What It Renders | Common Table Use Case |
|---|---|---|
| Basic | Plain text or number | Page ID, version number, space key, status |
| Image | Inline image (size adjustable) | Profile picture of last editor, page thumbnail |
| Link | Clickable hyperlink | Page title linking to the Confluence page |
| Collection | Array/list joined by separator | Labels as comma-separated list, contributors |
| Regex | Extracted or transformed text via pattern | Extracting version number from a title |
| Text | Formatted text with prefix, suffix, truncation, fallback | Truncated excerpt, 'N/A' fallback for empty fields |
Configuring Table View
- Set Report Type to Table in the header dropdown.
- Load required expansions in the left panel.
- Open the Columns tab in the right panel.
- Click + Add New Column - set Label, Block Type, and Source Field.
- Reorder columns by dragging the handle icon.
- Apply filters in the center panel to narrow results.
- Set Result Limit in the header.
- Review in Live Preview, then Save.
Export from Table View
| Format | How to Access | Best For |
|---|---|---|
| CSV | Export button → CSV | Excel, Google Sheets, stakeholder sharing |
| JSON | Export button → JSON | Developer use, API integrations |
| Config Recipe | Import tab → Copy JSON | Share report setup with team |
Best for: Content audits, governance reports, compliance tracking, contributor tracking, stale content review, and any report that benefits from side-by-side field comparison.