Analytics Dashboard
The Analytics Dashboard provides a four-tab view of team workload health, giving project managers and team leads real-time insight into allocation, risks, and bottlenecks.
Opening the Dashboard
Capacity Planner & Insight → Analytics Dashboard
Setting Scope
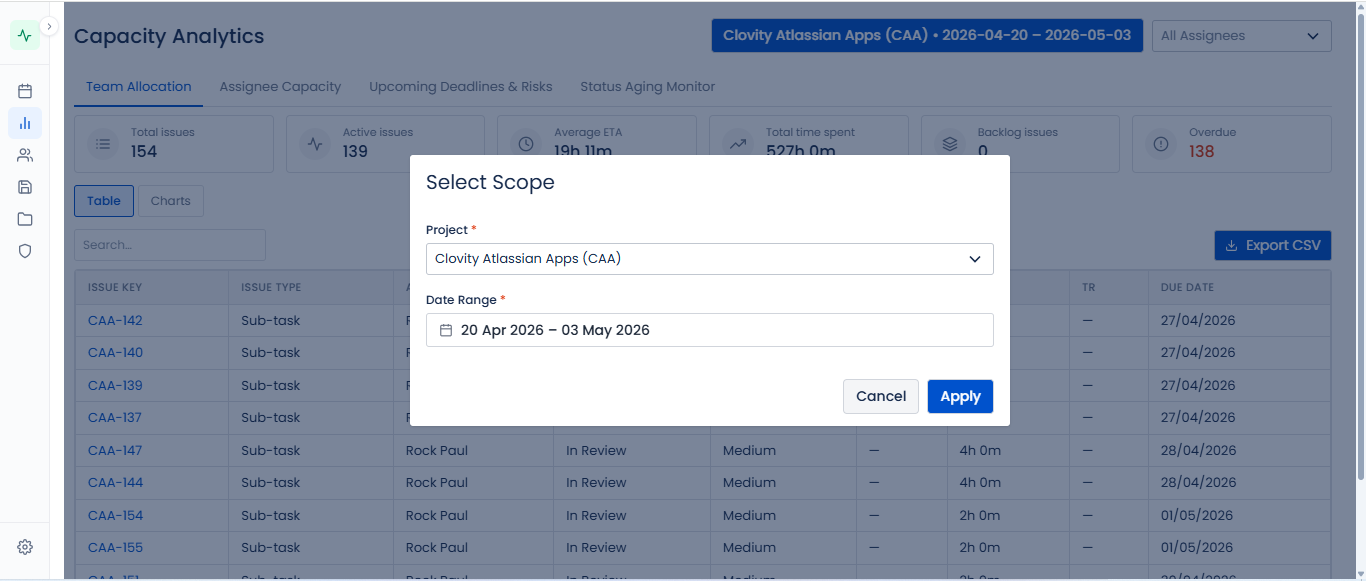
Before data loads, you must configure the scope:
- Click Scope (top-right)
- Select Project(s) and Date Range
- Optionally add Users or Teams filters
- Click Apply
Tab 1 - Team Allocation
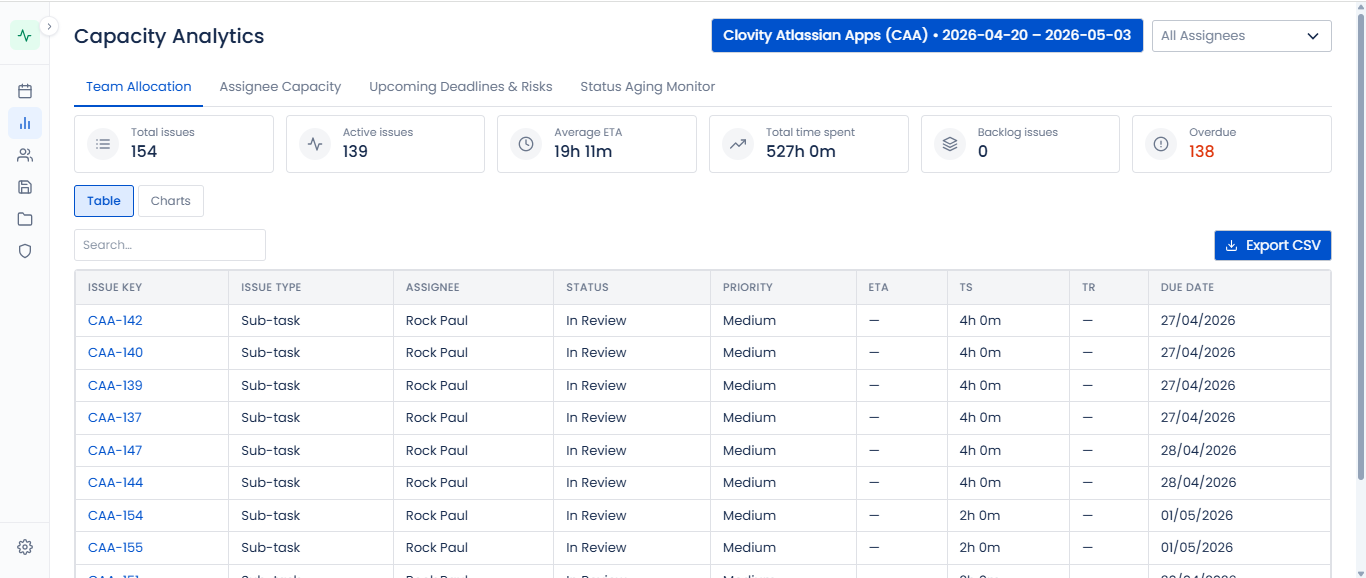
Provides an overview of how issues are distributed across the team.
- Total issue count and estimated hours per group
- Breakdown by issue status, issue type, and priority
- Use to spot uneven distribution or overloaded issue types at a glance
Tab 2 - Assignee Capacity
Shows per-person workload metrics to identify over- or under-allocation.
| Column | Meaning |
|---|---|
| Assignee | Team member name |
| Issues | Number of assigned open issues |
| Original Estimate | Total originally estimated hours |
| Remaining Estimate | Hours of work remaining |
| Logged | Hours already logged |
| Allocation | Remaining estimate as % of available hours |
Use before sprint planning to confirm no team member is already over-committed.
Tab 3 - Upcoming Deadlines & Risks
Lists issues near or past their due date, sorted by risk level.
| Column | Meaning |
|---|---|
| Issue | Jira issue key and summary |
| Assignee | Who is responsible |
| Due Date | Jira due date |
| Remaining | Remaining estimate |
| Risk Level | Overdue / At Risk / On Track |
Use for weekly stakeholder updates to communicate delivery risks proactively.
Tab 4 - Status Aging Monitor
Identifies issues that have been stuck in the same status for too long.
- Configurable threshold (e.g., flag issues in "In Review" for 5+ days)
- Ordered by days stuck (longest first)
- Reveals review bottlenecks and blocked handoffs
Configuring the threshold: click Settings icon → enter the number of days per status → Save
Tips
- Check Tab 2 (Assignee Capacity) before every sprint commitment meeting
- Use Tab 3 (Deadlines & Risks) for weekly stakeholder status reports
- Set realistic aging thresholds in Tab 4 - too low creates noise, too high misses real blockers