Working with Core Modules
This guide is a complete reference for all five major functional areas of the app.
Module 1 - Capacity Planner & Insight
Capacity Planner
The Capacity Planner is a timesheet-style view showing team workload distribution.
Creating a Plan:
- Capacity Planner & Insight → Capacity Planner → Create New Planner
- Select Users / Groups / Teams to include
- Choose date range and view mode (Days, Weeks, Months)
- The planner generates a capacity distribution view
Planner Layout:
| Column | Description |
|---|---|
| User / Group / Team | Left column - people/groups in the plan |
| Issue rows | Each row shows an issue with estimated and remaining hours |
| Date columns | Hours for each specific date/week/month |
| Total row | Aggregates hours across all rows |
Grouping Options: User → Issue | Team → User → Issue | Issue Type → User
Saving a Plan: click Save → enter name → Confirm. Reload from Saved Plans in the sidebar.
Analytics Dashboard
The Analytics Dashboard provides a four-tab view of team workload health.
Setup: Capacity Planner & Insight → Analytics Dashboard → click Scope → select Project + Date Range → Apply
Tab 1 - Team Allocation:
- Issue distribution by status, type, and priority across the team
- Total issue count and estimated hours per group
- Spot over-loaded statuses or issue types at a glance
Tab 2 - Assignee Capacity:
- Issue count, original estimates, and logged time per assignee
- Compare estimated remaining work vs. available capacity
- Identify over- or under-allocated team members before sprint commitments
Tab 3 - Upcoming Deadlines & Risks:
- Issues near or past their due date, sorted by risk level (overdue first)
- Shows remaining estimate alongside the due date
- Use for weekly stakeholder updates
Tab 4 - Status Aging Monitor:
- Issues stuck in the same status for an unusually long time
- Configurable threshold (e.g., flag "In Review" issues older than 5 days)
- Reveals review bottlenecks and blocked handoffs
Saved Plans
- After configuring the Capacity Planner, click Save
- Saved plans appear in the Saved Plans sidebar section
- Click any saved plan name to reload its configuration
- Manage: rename (edit icon), delete (trash icon), or duplicate (open → modify → save new name)
Capacity Report
The Capacity Report provides a tabular breakdown of available hours, estimated work, and logged hours.
Configuration:
- Filters: Project, Users, Teams, Date Range, Issue Type
- Group By: Assignee, Team, Project
- View Modes: Days, Weeks, Months
Reading the Report:
| Column | Meaning |
|---|---|
| Available | Total available working hours (based on working days and hours/day settings) |
| Estimated | Sum of remaining estimates on assigned issues |
| Logged | Actual hours logged in Jira worklogs |
| Allocation % | Estimated hours as a percentage of available hours |
Export: Export → CSV
Module 2 - Time Tracking & Reporting
My Calendar
My Calendar is a personal daily view of your logged time.
- Each day cell shows total hours logged for that date
- Hover on a day cell to see a summary of worklogs
- Click a day cell to see the detailed list of issues logged that day
- Logging time from the calendar: click the day cell → Log Time → search issue → enter hours → select category → Save
- Editing a worklog: click the day cell → find the worklog → click the Edit (pencil) icon
- Deleting a worklog: click the day cell → find the worklog → click the Delete (trash) icon
- Use the < > arrows to navigate months; click Today to return to current date
My Timesheet
My Timesheet is a personal tabular view of your logged time.
| Component | Description |
|---|---|
| Filter Bar | Set project, date range, account, and category filters |
| Group By | Add grouping dimensions (Project, Issue, Date, Account, etc.) |
| Date Columns | Each column shows hours for a specific date/week/month |
| View Mode Toggle | Switch between Days, Weeks, and Months |
Recommended Group-By Combinations:
| Goal | Group By Setting |
|---|---|
| Project breakdown | Project → Issue |
| Day-by-day view | Issue → Date |
| Billing view | Account → Project → Issue |
Timesheet Report Builder
The Report Builder shows time logged by the entire team with full filtering and grouping.
| Component | Description |
|---|---|
| Report Name | Click the title to rename; auto-saves on blur |
| Add Filter | Set Project, Users, Accounts, Date Range, Time Category |
| Group By | Stack multiple grouping levels for nested reports |
| View Mode | Days, Weeks, or Months column display |
| Log Time | Quick-log button available within the report |
| Chart Section | Bar or pie chart of logged time (included in PDF exports) |
| Export | CSV (data) or PDF (formatted report with charts) |
Filters and Grouping
Available Filters:
| Filter | Description |
|---|---|
| Project | Limit results to one or more Jira projects |
| Users / Assignee | Filter to specific team members |
| Date Range | From and To date picker |
| Account | Filter by billing account |
| Time Category | Filter by category type |
| Issue Type | Filter by Jira issue type |
| Sprint | Filter by active or past sprints |
Grouping Dimensions: Project, Assignee, Issue, Issue Type, Priority, Status, Reporter, Label, Sprint, Parent, Account, Time Category, Date
Billing Accounts
Billing Accounts categorize worklogs by client or engagement.
- Create: Time Tracking → Accounts → Create Account → Name + Key → Save
- Use when logging: select from the Account dropdown in the Log Time form
- Filter reports: Add Filter → Account in the Report Builder
- Group reports: Group By → Account → Project → Issue for billing breakdown
- Export: CSV from filtered report for upload to billing/invoicing systems
Time-Tracking Settings
Access from Settings → Time Tracking tab:
| Setting | Options | Default |
|---|---|---|
| Time Display Unit | Jira default, Hours/Minutes, Hours, Days | Jira default |
| Default Time Range | Current month/quarter/year/week/day | Current month |
| Timezone Mode | Jira timezone / User's timezone / My timezone | Jira timezone |
| First Day of Week | Sunday–Saturday | Monday |
| Working Days | Mon–Fri checkboxes | Mon–Fri |
| Hours Per Day | Number input | 8 |
Module 3 - Portfolio Management (PPM)
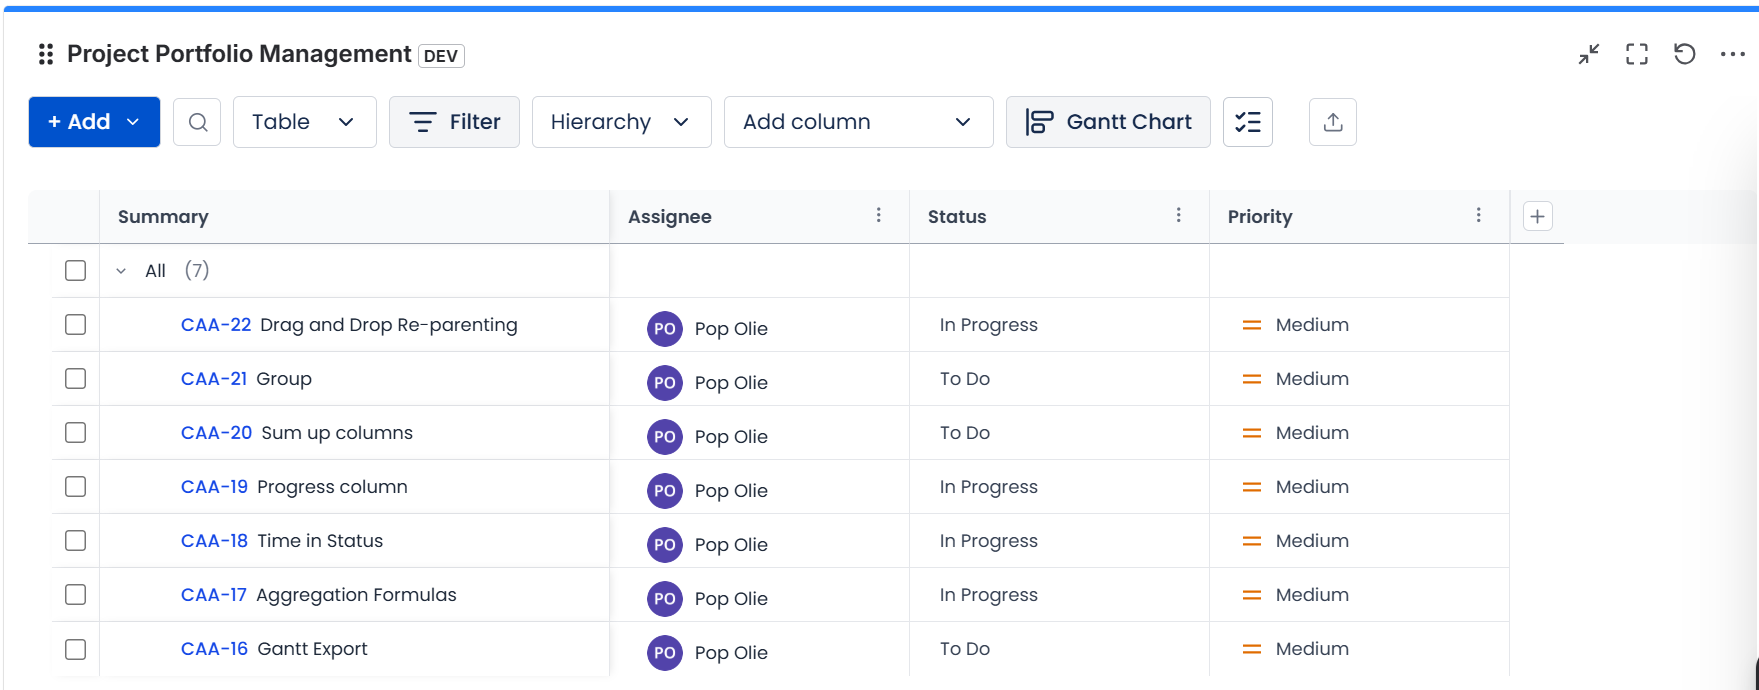
Creating a Portfolio
- Portfolio (PPM) → New Portfolio → enter name
- Click Filter → choose Manual Filter (dropdowns) or JQL
- Click Apply to preview matching issues
- Click Save - appears in sidebar Portfolios section
Example JQL Scopes:
- All active epics:
issuetype = Epic AND status != Done ORDER BY priority DESC - High-priority due this quarter:
priority in (Highest, High) AND due >= startOfQuarter()
Important: Save immediately after creating - unsaved portfolios are lost on navigation.
View Types
| View | Best For |
|---|---|
| Table | Detailed review, bulk editing, data export |
| Gantt Chart | Roadmap presentations, dependency visualization, timeline planning |
| Graph View | Epic-story-subtask hierarchy visualization |
| Treemap | Visual health check; issue size proportional to effort metric |
| Pie Chart | Status/priority distribution for stakeholder reports |
| Board View | Kanban-style workflow tracking, fast triage |
Switching Views: use the view mode selector in the top-right of the portfolio.
Gantt Chart - Detailed Reference
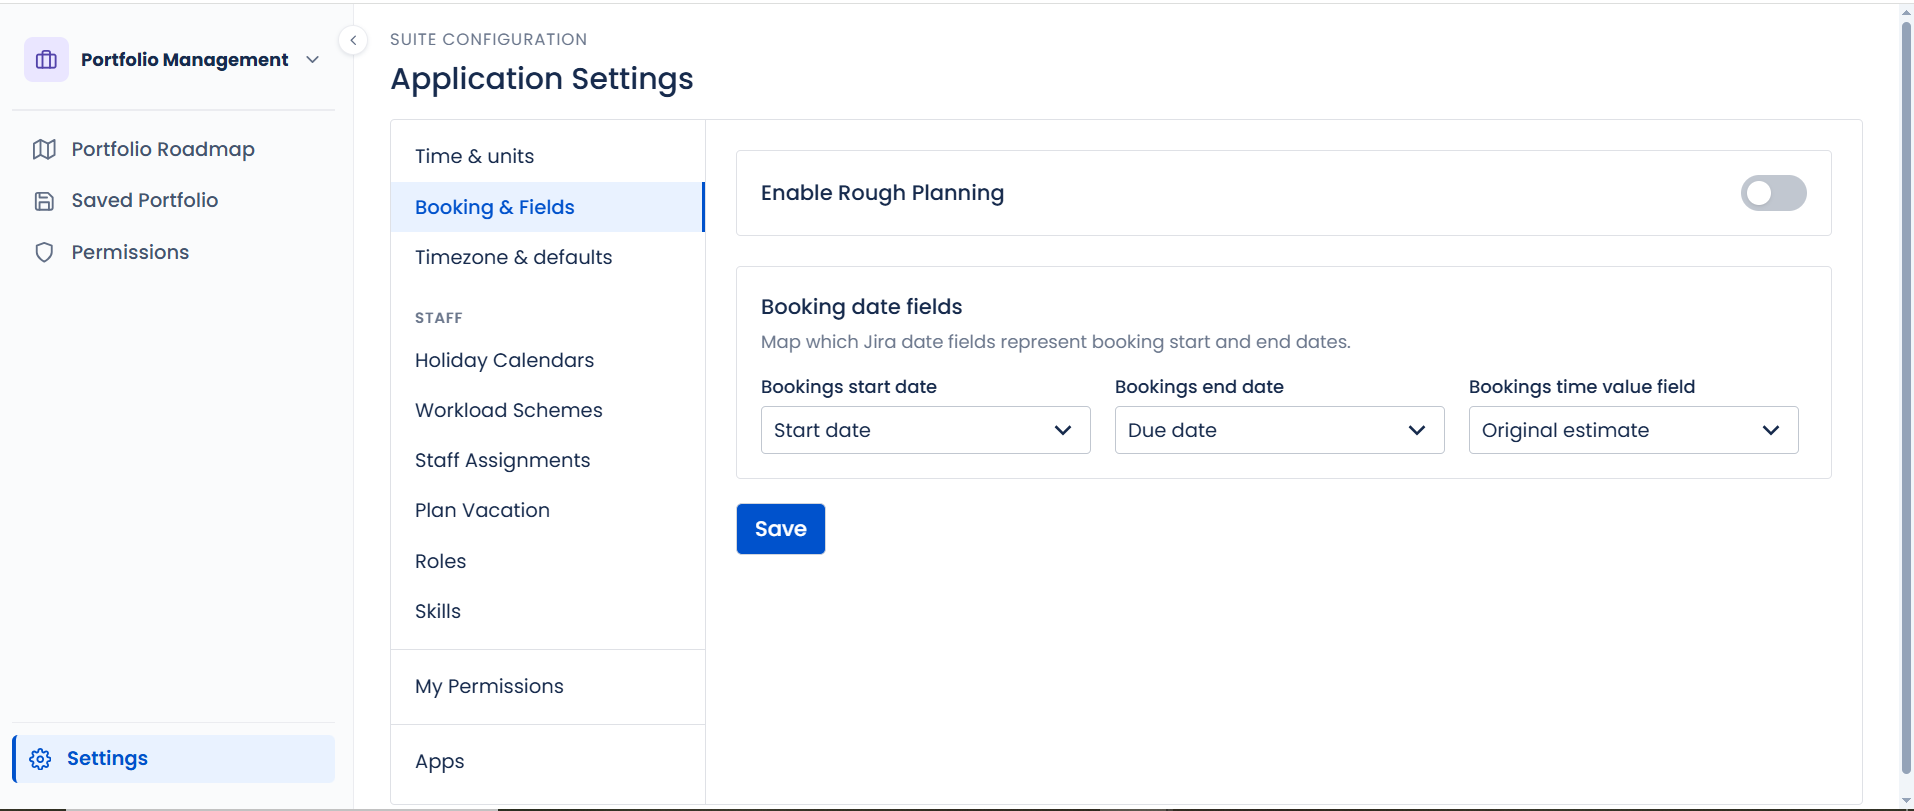
- Render requirement: Issues must have Start Date and Due Date fields mapped in Portfolio Settings
- Drag bar edges to update Jira start/due dates directly
- Create dependencies: hover bar end → drag connector dot → drop on dependent bar start
- Dependency types: FS (Finish-to-Start), SS (Start-to-Start), FF (Finish-to-Finish), SF (Start-to-Finish)
- Baseline mode: compare current plan against a saved baseline
- Critical path: highlighted automatically based on dependency chain
Saved Portfolios
- All users with Member+ role can see saved portfolios
- Rename: click the portfolio name → type new name → press Enter
- Edit scope: open portfolio → Settings → modify filter → Save
- Delete: Settings → Delete (confirmation required)
- Tip: coordinate edits to shared portfolios - last save wins
Dashboard Gadget
Adds portfolio metrics to any Jira dashboard.
Adding:
- Jira dashboard → Add Gadget → search "Project Portfolio Management" → Add
- Configure gadget: select portfolio/scope → Save
Troubleshooting:
- No data: verify portfolio scope still returns issues and you have read access
- Blank after setup: remove and re-add the gadget with fresh configuration
Portfolio Settings
Access: Portfolio → Settings gear icon → Portfolio Settings tab, or global Settings → Portfolio tab
| Setting | Description |
|---|---|
| Time Display Unit | How hours display in portfolio table |
| Bookings start date | Which Jira field maps to the Gantt bar start (e.g., Start date) |
| Bookings end date | Which Jira field maps to the Gantt bar end (e.g., Due date) |
| Hours per day | Converts story points/day estimates to hours |
| Working days | Days counted as working days in capacity calculations |
Module 4 - Backlog Prioritization
Backlog Table
The Backlog Table is a sortable, filterable table with inline-editable scoring metrics.
Setup: Backlog Prioritization → Backlog Table → select Project → choose Scoring Template
Scoring Issues:
- Click any metric cell to edit inline
- Input types: Number field, Dropdown, Star rating (1–5), Effort scale (XS/S/M/L/XL)
- The Score column recalculates automatically - changes save instantly
Sorting: click any column header (Score ↓ = highest priority first)
Filtering: Issue Type, Status, Assignee, Label, Sprint, Priority
Scoring Templates
Built-in Templates:
| Template | Formula | Best For |
|---|---|---|
| ICE | Impact × Confidence × Ease | Feature requests and bugs |
| RICE | (Reach × Impact × Confidence) / Effort | Product features with reach |
| WSJF | (Business Value + Time Criticality + Risk Reduction) / Job Size | SAFe/ART prioritization |
| Value vs. Effort | Value / Effort | Simple two-dimension ranking |
Creating a Custom Template:
- Template selector → Manage Templates → Create New Template
- Enter name, add metrics (name, input type, range)
- Enter formula referencing metric names
- Click Save
Priority Matrix
The Priority Matrix is a scatter plot placing each issue on two axes.
- Open: Backlog Table → Matrix view button (top-right)
- Each dot = one issue; hover to see details
- Quadrants: Quick Wins (high value, low effort), Big Bets, Fill-ins, Avoid
- Customize axes: click Matrix Settings → choose any numeric metric for X and Y
- Drag quadrant divider lines to reposition boundaries
Views, Filters & Sorting
- View toggle: Table ↔ Matrix (top-right view switcher)
- Saved Views: Save → enter name → reload from Saved Views in sidebar
- Clear Filters: resets all active filters to full unfiltered list
Saved Prioritized Reports
Saves a snapshot of the backlog scoring at a specific point in time.
Saving: Backlog Table → score issues → Save Report → enter name → Confirm
What a Saved Report Preserves: project selection, scoring template, metric values per issue, sort and filter configuration
What It Does Not Preserve: current Jira issue statuses, new issues added after save, template changes
Module 5 - Teams Management
Teams
Teams are named groups of Jira users reused across Capacity, Time Tracking, and Portfolio.
Creating a Team:
| Field | Required | Description |
|---|---|---|
| Team Name | Yes | Display name (e.g., "Platform Team") |
| Description | No | Brief description |
| Color | No | Color tag for visual identification |
| Source | Yes | Manual (add members individually) or Jira Group (auto-sync) |
| Members | Yes | Add by user search or Jira Group selection |
Source Types:
- Manual: members stay fixed until you edit the team
- Jira Group: members auto-sync from the Jira group - changes to the group reflect in the team
Using Teams in Other Modules:
- Capacity Planner: Group By → Team
- Capacity Report: Filter by Team
- Time Tracking Report: Filter or Group by Team
Programs
Programs group multiple Teams into higher-level organizational structures.
Creating a Program:
- Teams → Programs tab → Create Program
- Enter Program Name, select Teams to include → Save
Hierarchy: Program → Team A (Members) → Team B (Members)
Best use cases:
- Model departmental structure (Engineering → Platform, Frontend, Backend teams)
- Program Increment planning (PI-2025-Q2 → Sprint Teams)
- Leadership capacity rollups (Program → Team → User in Capacity Planner)