User Guide
Capacity Report
The Capacity Report provides a structured tabular breakdown of available hours, estimated work, and logged hours - giving managers a precise view of team utilisation.
Opening the Capacity Report
Capacity Planner & Insight → Capacity Report
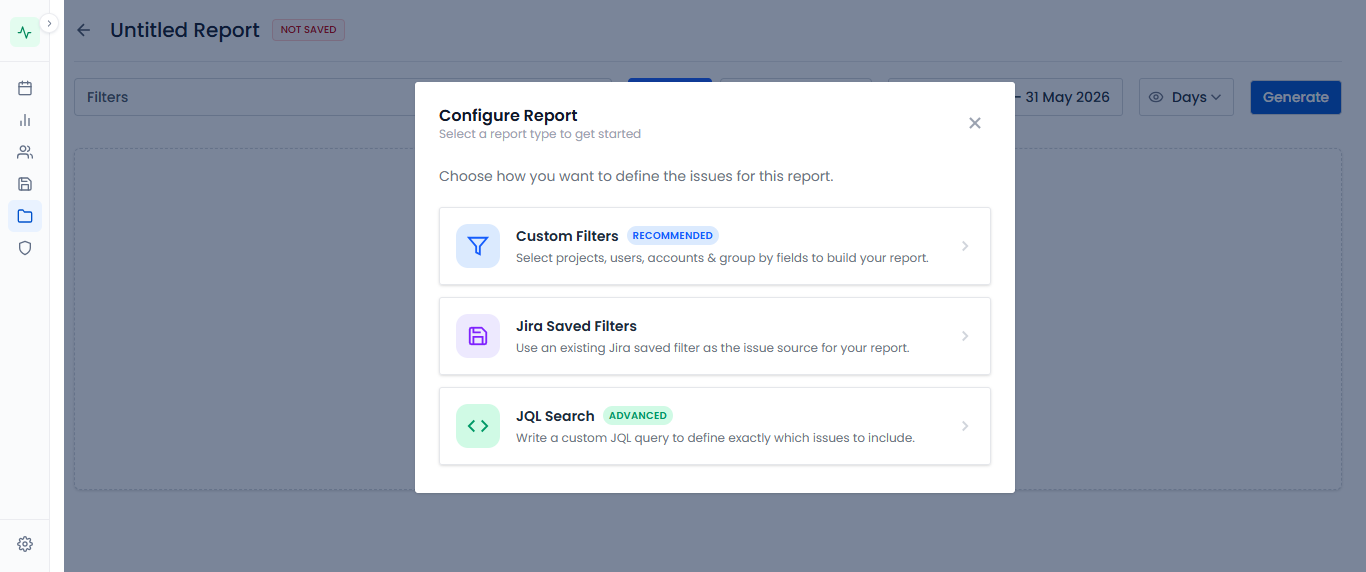
Configuring the Report
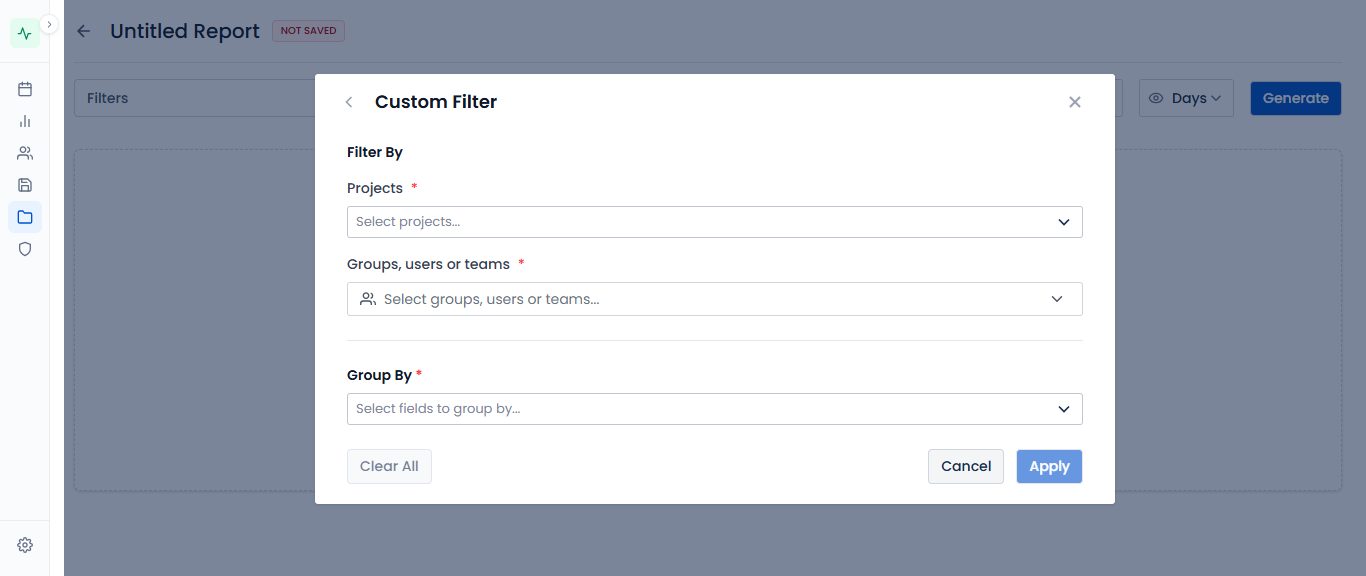
| Control | Options |
|---|---|
| Project | One or more Jira projects |
| Users | Filter to specific individuals |
| Teams | Filter by teams from Teams Management |
| Date Range | From and To date picker |
| Issue Type | Story, Bug, Task, Sub-task, Epic |
| Group By | Assignee · Team · Project |
| View Mode | Days · Weeks · Months |
Click Apply after setting all controls.
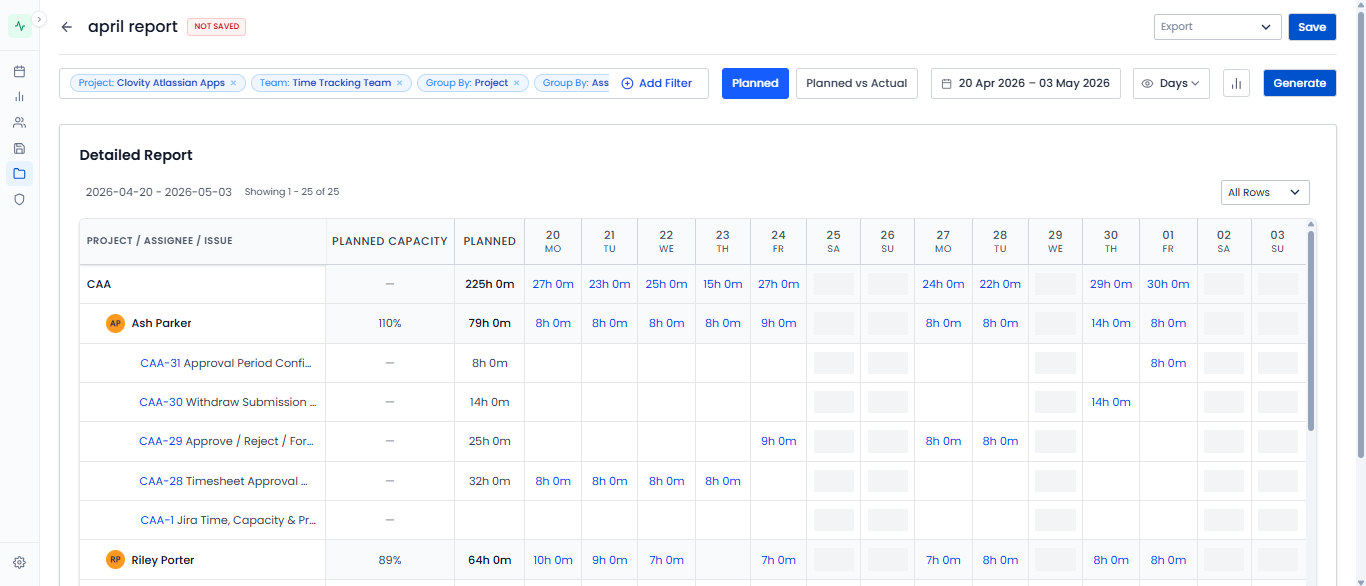
Reading the Report
| Column | Meaning |
|---|---|
| Name | User / Team / Project (based on Group By) |
| Available | Total working hours available (working days × hours/day from Settings) |
| Estimated | Sum of remaining estimates on assigned open issues |
| Logged | Actual hours logged via Jira worklogs |
| Allocation % | Estimated ÷ Available × 100 - higher means more committed |
Allocation Interpretation
| Allocation % | Status |
|---|---|
| < 70% | Under-utilised - capacity available |
| 70–100% | Healthy utilisation |
| > 100% | Over-allocated - risk of missed commitments |
Exporting
Click Export → CSV to download the full report as a spreadsheet.
The CSV includes all rows, columns, and grouping levels for import into Excel, Google Sheets, or BI tools.
Tips
- Run the Capacity Report at the start of sprint planning to validate commitments before finalising
- Group by Team for a leadership-level rollup; group by Assignee for individual workload detail
- Set Hours Per Day and Working Days correctly in Settings - inaccurate settings skew the Available column